3D for e-commerce8 min read
Black Friday 2025: Orders 2.8x October, Product Views 1.4x
CharpstAR analysis of eight e-commerce sites in Black Week 2025: median orders were 2.8 times the October daily average, product page views 1.4 times.
By CharpstAR · 17 Nov 2026
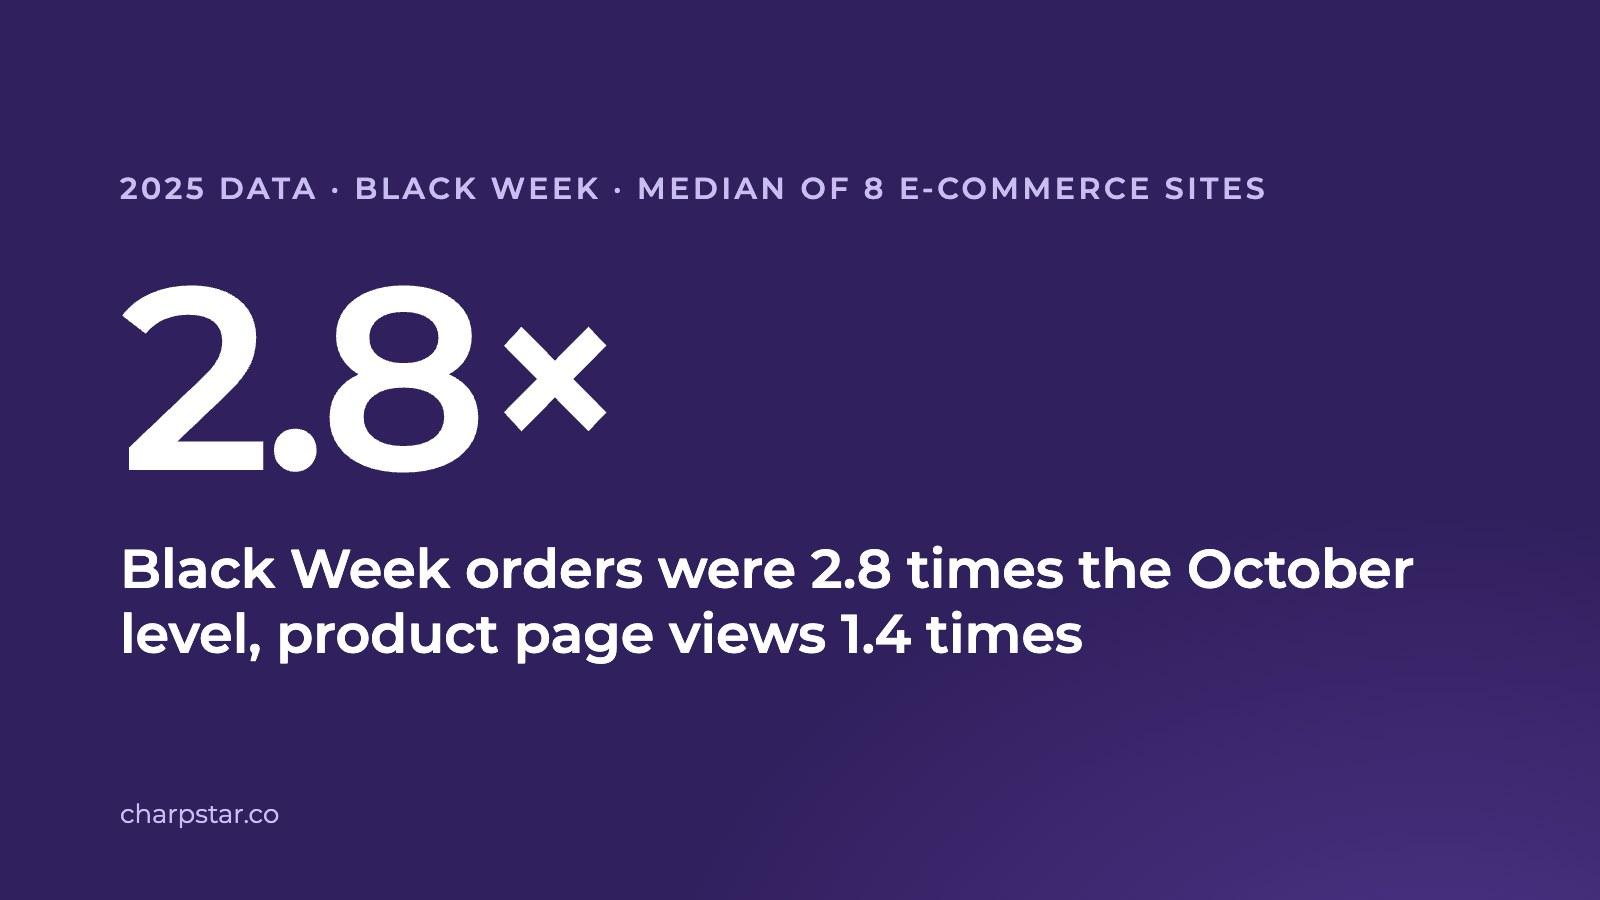
In Black Week 2025, the week of Black Friday, orders per day on eight e-commerce sites were a median of 2.8 times the October daily average, and product page views 1.4 times. Of 8,172 purchased items matched to an earlier view of the product, 80% were bought within 24 hours of the first view. CharpstAR analysed the Google Analytics 4 data of the eight sites, which sell furniture, home furnishings, lighting, rugs, outdoor and water sports equipment, saunas, and electric scooters and bikes.
1. Orders Rose More Than Product Page Views on All Eight Sites

Orders rose more than product page views on every site. The median of the eight sites was 2.8 times the October daily average for orders and 1.4 times for product page views. On three sites product page views were level with October or below it, at 0.6 to 1.0 times, and orders were 1.1 to 2.0 times higher.
Three of the sites also have data for October 2024. In Black Week 2024 their orders were 3.3, 8.5 and 12.5 times the October daily average and their product page views 1.6, 3.7 and 2.4 times. In 2025 the same three sites were at 2.4, 6.7 and 7.2 times for orders and 1.5, 2.9 and 1.8 times for product page views.
2. Product Page Views per Order Fell by 30% to 75% Across the Sites
| Site sells | Product page views | Orders | Views per order |
|---|---|---|---|
| Home furnishings | 1.8× | 7.2× | -75% |
| Lighting | 2.9× | 6.7× | -57% |
| Water sports | 1.3× | 3.8× | -66% |
| Rugs | 1.6× | 3.3× | -52% |
| Furniture | 1.5× | 2.4× | -38% |
| Saunas | 1.0× | 2.0× | -50% |
| Electric scooters and bikes | 0.6× | 1.5× | -60% |
| Outdoor | 0.8× | 1.1× | -30% |
Views per order is product page views divided by orders. It fell on every site, and the median fall was 54%.
3. 80% of Items With a Known First View Were Bought Within 24 Hours

Of the 10,690 items bought from 24 November to 1 December 2025, 8,172 could be matched to an earlier view of the same product in the same browser. Of those, 80% were bought less than 24 hours after the first view and 6% more than a week after it. The 24-hour share was 81% in Black Week 2024 and 78% in October 2025.
The share falls as the price rises. It was 88% for the cheapest third of items, 81% for the middle third and 74% for the most expensive third. Among the seven sites with at least 250 matched items it ranged from 61% for home furnishings to 88% for lighting.
4. For 54% of Items Bought by 3D or AR Users, the First Use Was at Least a Day Earlier

On six of the sites the shopper presses a button to open 3D or AR. Shoppers who had used it in the 60 days before buying bought 503 items from 24 November to 1 December 2025. For 46% of those items the first use was less than 24 hours before the purchase. For 54% it was at least a day earlier, and for 27% more than a week earlier.
The share with a first use at least a day earlier was 52% in Black Week 2024 (433 items on four sites) and 45% in October 2025 (502 items). On the furniture site, which accounts for 206 of the 503 items, it was 62%.
Methodology
- Black Week: Monday 24 to Sunday 30 November 2025 for orders and product page views. The purchase timing in sections 3 and 4 also includes Monday 1 December.
- Baseline: the daily average of 6 October to 2 November 2025. For 2024, 25 November to 1 December is compared with 7 October to 3 November.
- Orders and product page views: GA4 purchase events and product view events per day. An order can contain several items, and sections 3 and 4 count items.
- First view: the earliest view of the purchased product in the same browser in the 60 days before the purchase. The 2,518 items with no such view are left out. They include purchases where the shopper looked on one device and bought on another.
- Price thirds: the items of each period are split into three equal groups by price.
- First use of 3D or AR: the shopper's earliest click on a 3D or AR button on the site, on any product, in the 60 days before the purchase. The other two sites open the 3D view without a click and are left out of section 4.
- Browsers: Safari shortens the life of cookies, which can hide an earlier view. In other browsers 7% of items were bought more than a week after the first view, compared with 6% across all browsers.
- Users: as counted by GA4, per browser and device, for shoppers who consented to analytics cookies.
- Exclusions: B2B office furniture sites that use CharpstAR, which do not run Black Friday campaigns.
Planning 3D and AR for Black Friday
If you want 3D and AR on your product pages for Black Friday, have the models live in the weeks before your deals start. In Black Week 2025, 27% of the items bought by shoppers who used 3D or AR were bought more than a week after the first use. An order of 200 models generally takes two to three weeks to produce, and the models are then reviewed by you and put live. Order about a month before your deals start.
CharpstAR builds the 3D models from your existing product photos and measurements. The viewer is added to product pages with one line of code on Shopify, Shopware, Magento, WooCommerce or a custom platform. It supports AR on iPhone and Android and sends its events to your Google Analytics.
A 3D viewer with AR starts at $10 per product variant per month on the Basic plan (minimum 100 variants, 12-month term, implementation included). A 3D configurator for colour and material options starts at $20 per model per month on the Value plan (minimum 100 models, 24-month term). Both include the models, hosting and updates. See pricing and case studies. The first product is built free of charge within ten working days. For the whole year, see how shoppers who used 3D or AR bought and the figures by product type.
Questions
How much did orders rise in Black Week 2025?
Orders rose to 2.8 times the October daily average, as the median of eight e-commerce sites. The sites ranged from 1.1 to 7.2 times.
Did product page views rise as much as orders?
No. Product page views were 1.4 times the October daily average as the median of the eight sites, and orders rose more than product page views on every site. Product page views per order fell by 30% to 75%.
How long before buying was the product first viewed in Black Week 2025?
Of the purchased items matched to an earlier view, 80% were bought within 24 hours of the first view and 6% more than a week after it. For the most expensive third of items the 24-hour share was 74%.
When should 3D models be ordered for Black Friday?
About a month before your deals start. An order of 200 models generally takes two to three weeks to produce, and the models are then reviewed by you and put live.
Can I use these figures?
Yes, with a link to this page as the source. The figures for each site are available as a CSV file on this page.