3D for e-commerce5 min read
Shoppers Who Used 3D or AR Bought 2.4x as Often: 2026 Data
CharpstAR analysis of 2.1 million shoppers on nine e-commerce sites in 2026: shoppers who used 3D or AR bought 2.4 times as often and added to cart 2.7 times as often.
By CharpstAR · 21 Oct 2026
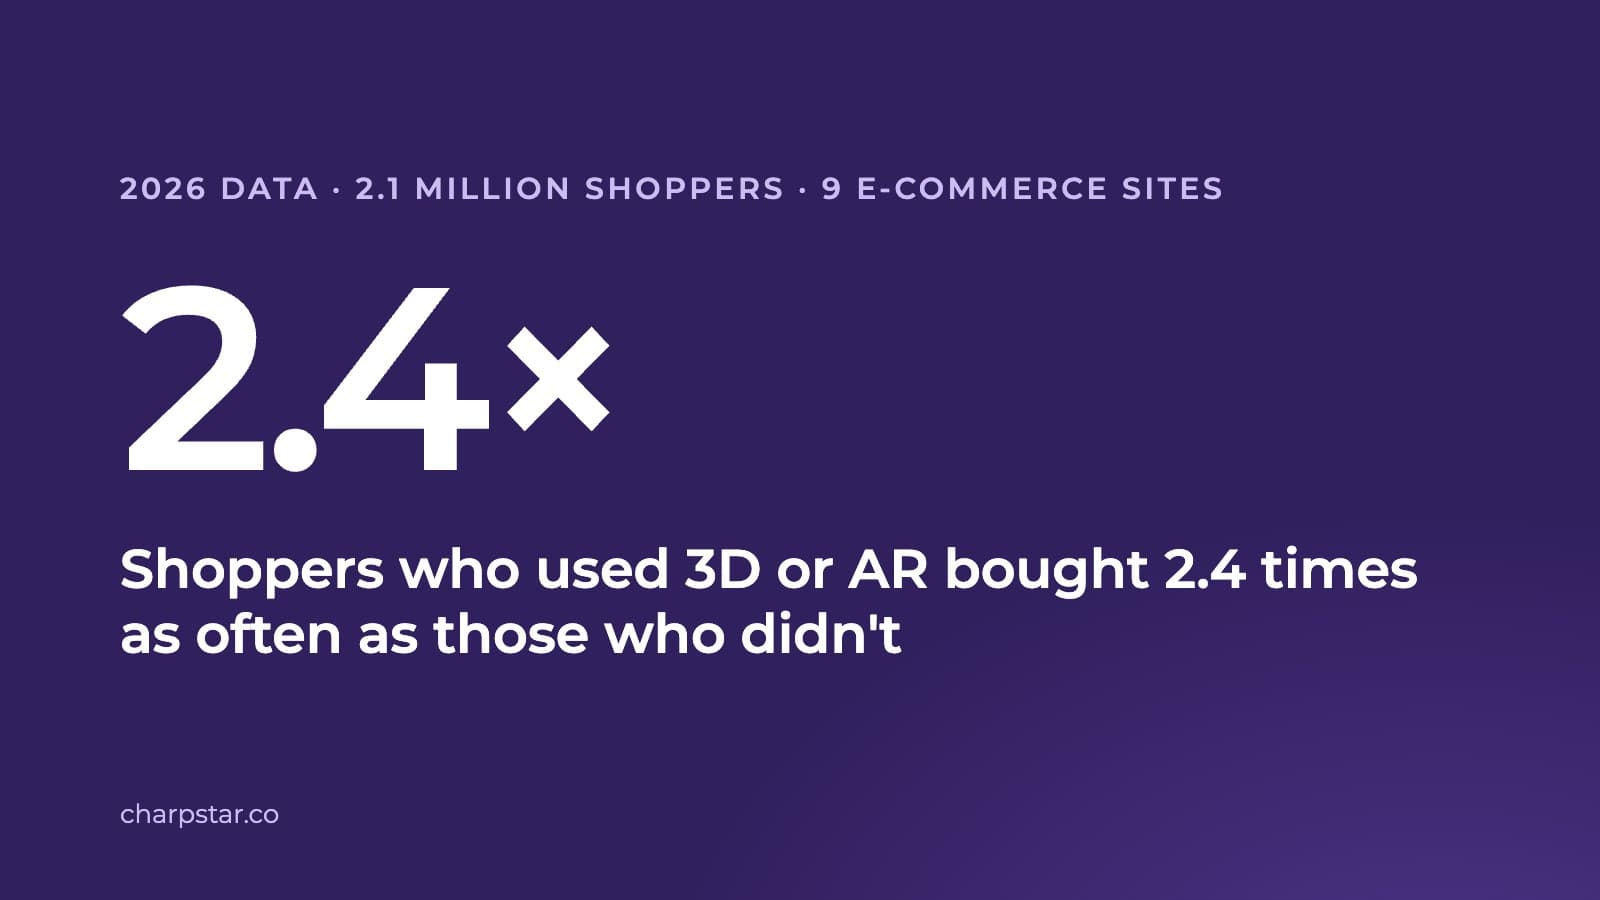
Shoppers who used a 3D view or AR on a product page bought 2.4 times as often as shoppers who did not. CharpstAR analysed the Google Analytics 4 data of nine e-commerce sites from 1 January to 19 October 2026, covering 2.1 million shoppers, and the difference appears on all nine sites.
1. Conversion and Add-to-Cart Rates Were More Than Twice as High

Of the shoppers who used 3D or AR, 7.4% made a purchase and 22.3% added a product to the cart, compared with 3.1% and 8.2% of shoppers who did not.
2. The Difference Holds on All Nine Sites

On each site, shoppers who used 3D or AR converted at 1.6 to 6.4 times the rate of shoppers who did not. The median site is at 2.5 times, and the nine sites pooled at 2.4 times.
3. Shoppers Who Used AR Converted Most Often

AR places the product in the shopper's room at full size through the phone camera. Of the 41,044 shoppers who used AR, 8.1% made a purchase, compared with 6.7% of shoppers who used only the 3D view.
4. Order Values Were Higher and Visits Longer
- Average order value was 29% higher for shoppers who used 3D or AR on the median site, and higher on 8 of the 9 sites. Order values are compared within each site, as the sites trade in different currencies.
- Time on page was 97 seconds per product page visit with 3D or AR and 34 seconds without, as the median across sites. On every site, visits with 3D or AR lasted 2.7 to 4.1 times as long.
Methodology
- 3D or AR use: a click on the 3D or AR button of a product page.
- Conversion: a purchase of any product after the shopper's first visit to a product page with 3D available, within the period. The add-to-cart rate is measured the same way.
- Aggregation: conversion and add-to-cart rates are pooled across the nine sites (6,184 buyers among shoppers who used 3D or AR, 61,229 among those who did not). Order value and time on page are calculated per site, and the median of the nine sites is reported.
- Time on page: GA4 engagement time per product page visit, capped at 30 minutes.
- Users: as counted by GA4, per browser and device, for shoppers who consented to analytics cookies.
- Exclusions: three further sites were excluded. Two load the 3D view automatically, so every visitor registers as a 3D user, and one had incomplete event data for the period.
Adding 3D and AR to Your Product Pages
CharpstAR builds 3D models from your existing product photos and measurements. The viewer is added to product pages with one line of code on Shopify, Shopware, Magento, WooCommerce or a custom platform, supports AR on iPhone and Android, and sends its events to your Google Analytics, so the same comparison can be run on your own site.
A 3D viewer with AR starts at $10 per product variant per month on the Basic plan (minimum 100 variants, 12-month term, setup included). A 3D configurator for fabric and colour options starts at $20 per model per month on the Value plan (minimum 100 models, 24-month term). Both include models, hosting and updates. See pricing and case studies. The first product is built free of charge within ten working days.
Questions
How much more often did shoppers who used 3D or AR buy?
2.4 times as often across nine e-commerce sites in 2026: 7.4% of shoppers who used 3D or AR made a purchase, compared with 3.1% of those who did not. The difference appeared on all nine sites.
What was the conversion rate of shoppers who used AR?
8.1% of the 41,044 shoppers who used AR made a purchase, compared with 6.7% of those who used only the 3D view and 3.1% of those who used neither.
How long did shoppers spend on product pages with 3D?
97 seconds per visit with 3D or AR and 34 seconds without, as the median across the nine sites.
Which retailers are included?
Six retailers using CharpstAR 3D and AR, with nine e-commerce sites selling furniture, office furniture, rugs, home and garden products, e-bikes, kayaks and outdoor gear. Results are reported in aggregate and per site.
Can I use these figures?
Yes, with a link to this page as the source. The full data set is available as a CSV file on this page.