Furniture and home6 min read
Sofa Shoppers Who Used 3D or AR Bought 6.9x as Often: 2026 Data
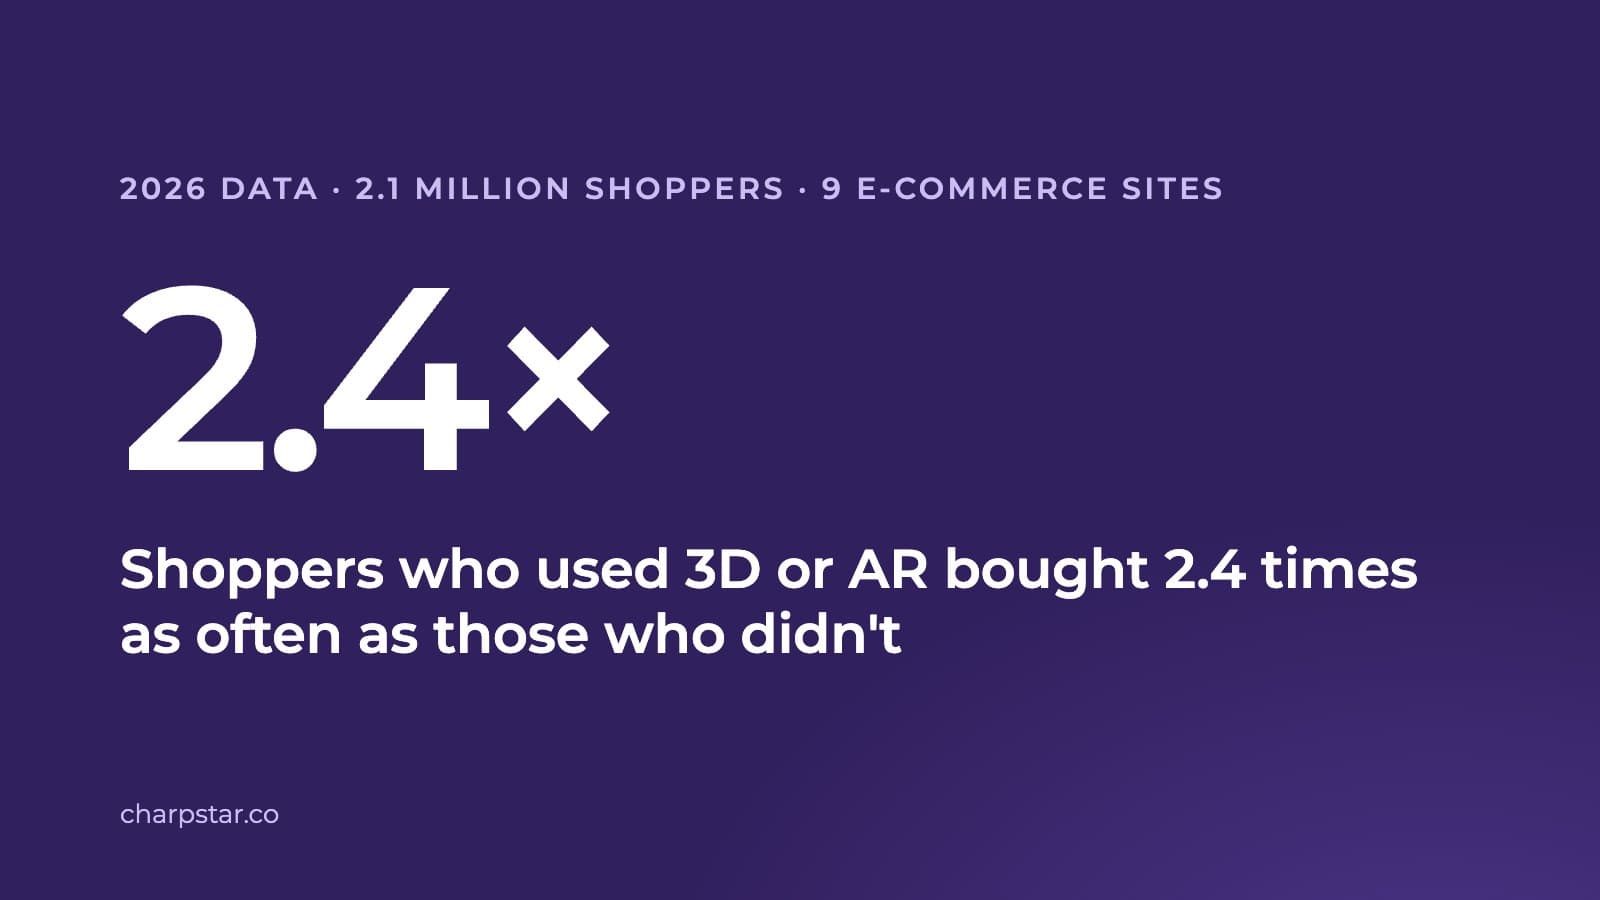
CharpstAR analysis of 2.1 million shoppers on nine e-commerce sites, by product type: the relative difference between shoppers who used 3D or AR and those who did not was largest for home furniture.
By CharpstAR · 23 Oct 2026
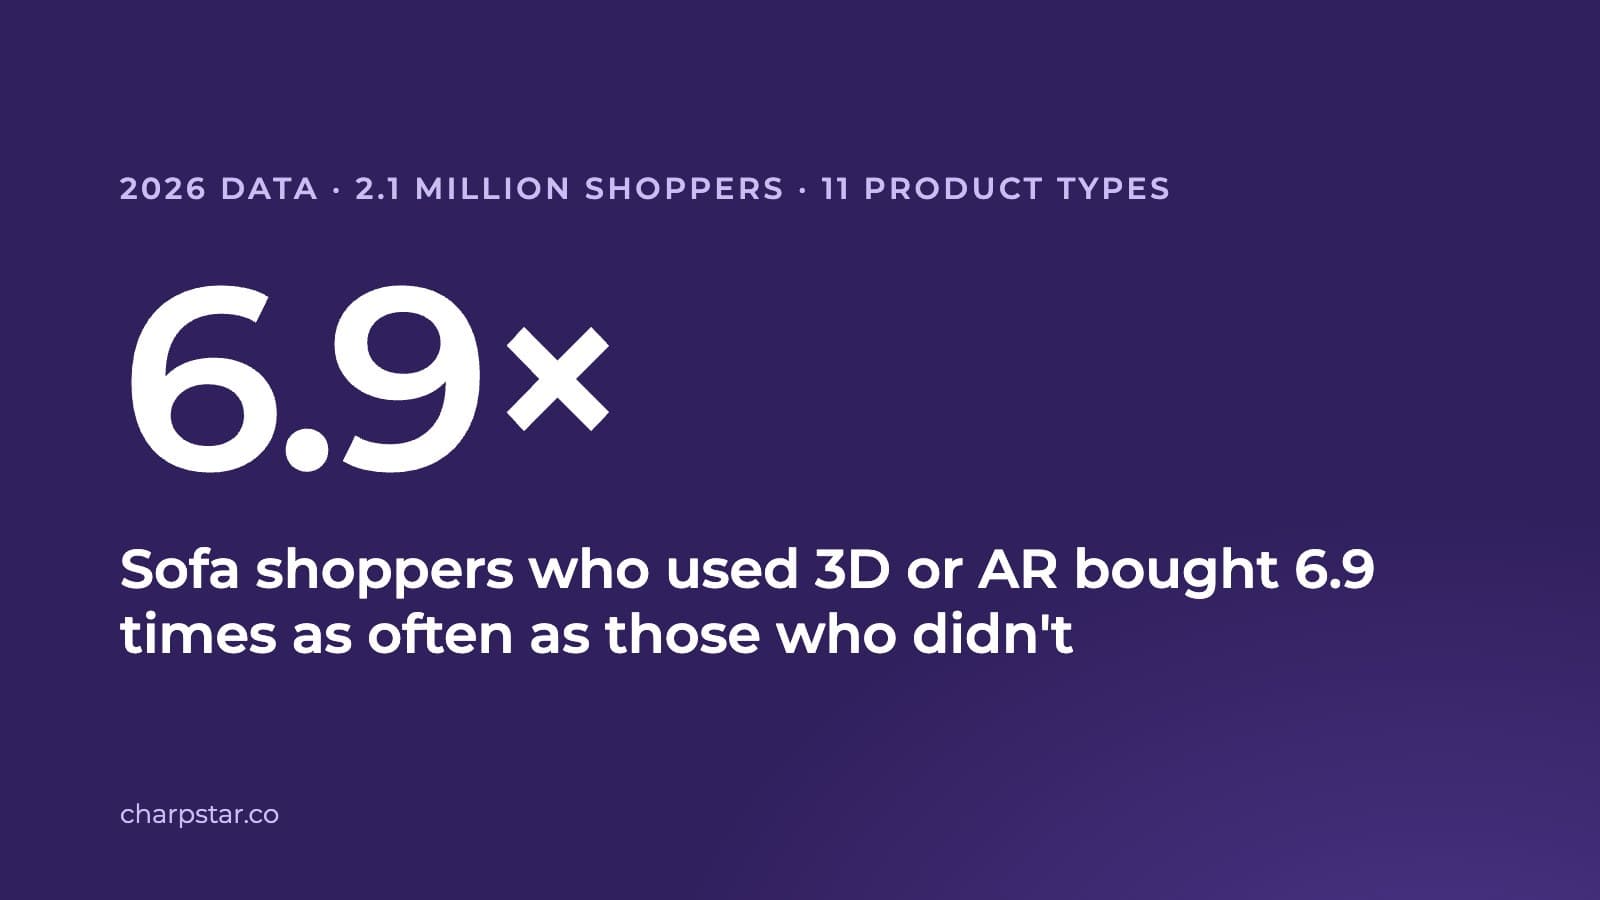
Among shoppers looking at sofas, those who used 3D or AR bought 6.9 times as often as those who did not. Home furniture shows the largest relative difference of the product types analysed: 4.7 to 5.8 times for beds, coffee tables and armchairs. CharpstAR analysed the Google Analytics 4 data of nine e-commerce sites from 1 January to 19 October 2026, grouping each shopper by the product on the first page where they saw 3D.
1. Home Furniture Shows the Largest Relative Difference

Among sofa shoppers, 4.8% of those who used 3D or AR made a purchase, compared with 0.7% of those who did not. Shoppers who used 3D or AR made up 5.2% of sofa shoppers and 28% of sofa buyers.
Furniture
Corner sofa
Five fabrics, oak legs.

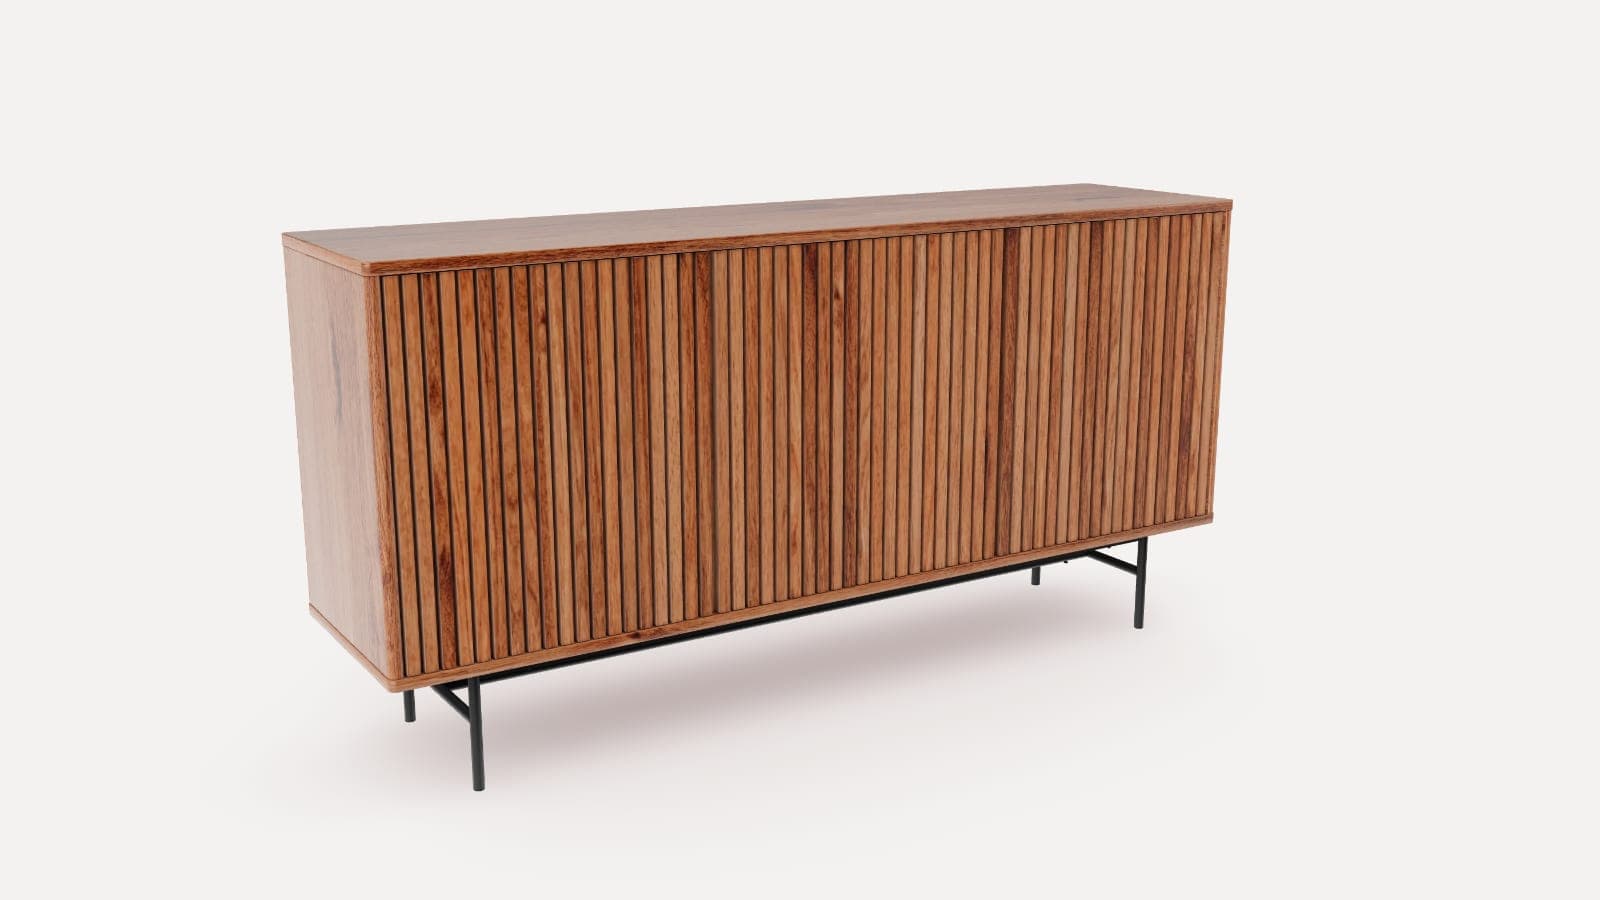
Switch between five fabrics and zoom in to see the weave. Open Dimensions for the size. On a phone, the AR button places the sofa in your own room.
Beds and headboards follow at 5.8 times, coffee and side tables at 5.5 times, and armchairs, chairs and poufs at 4.7 times. Across the four home furniture types, covering 629,638 shoppers, the figure is 6.5 times. These types also have the lowest conversion rates among shoppers who did not use 3D or AR, at 0.7% to 1.0%.
2. Conversion Rates by Product Type
| Product type | Sites | Used 3D or AR | Did not | Multiple |
|---|---|---|---|---|
| Sofas | 2 | 4.8% | 0.7% | 6.9× |
| Beds and headboards | 2 | 5.9% | 1.0% | 5.8× |
| Coffee and side tables | 2 | 5.4% | 1.0% | 5.5× |
| Armchairs, chairs and poufs | 2 | 4.5% | 1.0% | 4.7× |
| Rugs | 1 | 13.1% | 3.2% | 4.1× |
| E-bikes | 2 | 6.4% | 1.6% | 4.0× |
| Fitness equipment | 1 | 15.4% | 4.2% | 3.6× |
| Tents and gazebos | 1 | 10.8% | 3.9% | 2.8× |
| Office furniture | 3 | 6.0% | 2.4% | 2.5× |
| Kayaks and SUP boards | 1 | 13.8% | 7.1% | 1.9× |
| E-scooters | 1 | 6.0% | 4.3% | 1.4× |
For every product type, shoppers who used 3D or AR converted at a higher rate than shoppers who did not.
3. Rugs Have the Highest Share of AR Use
Of the shoppers who used 3D or AR on rug pages, 58% pressed the AR button, the highest share of the 11 product types. For office furniture and e-scooters the share is 55%, and for sofas, beds and coffee tables 46% to 47%.
Methodology
- Product type: each shopper is grouped by the product on the first page where they saw the 3D button, using the page address and the site's own Google Analytics product categories. "Sofa shoppers" are shoppers whose first such page was a sofa.
- 3D or AR use: a click on the 3D or AR button on any product page in the period.
- Conversion: a purchase of any product after the shopper's first visit to a product page with 3D available, within the period.
- Aggregation: rates are pooled across the sites that sell each product type; the table shows how many sites each type comes from. Types shown have at least 50 buyers among shoppers who used 3D or AR. Pages outside these types, such as spare parts, accessories and décor, are counted in the sample total.
- Users: as counted by GA4, per browser and device, for shoppers who consented to analytics cookies.
- Sites: the same nine e-commerce sites as in our shopper statistics.
3D and AR for Furniture Product Pages
CharpstAR builds 3D models of sofas, beds, tables and chairs from your existing product photos and measurements. The viewer is added to product pages with one line of code on Shopify, Shopware, Magento, WooCommerce or a custom platform, supports AR on iPhone and Android, and sends its events to your Google Analytics, so the same comparison can be run on your own site.
A 3D viewer with AR starts at $10 per product variant per month on the Basic plan (minimum 100 variants, 12-month term, setup included). A 3D configurator for fabric and colour options starts at $20 per model per month on the Value plan (minimum 100 models, 24-month term). Both include models, hosting and updates. See pricing and case studies. The first product is built free of charge within ten working days.
Questions
How much more often did sofa shoppers who used 3D or AR buy?
6.9 times as often: 4.8% of sofa shoppers who used 3D or AR made a purchase, compared with 0.7% of those who did not, across nine e-commerce sites in 2026.
Which product types show the largest difference?
Home furniture: sofas (6.9 times), beds and headboards (5.8), coffee and side tables (5.5) and armchairs, chairs and poufs (4.7). Across the four types the figure is 6.5 times. Rugs and e-bikes follow at 4.1 and 4.0 times.
Which product type has the highest share of AR use?
Rugs. 58% of the shoppers who used 3D or AR on rug pages pressed the AR button, compared with 46% to 47% for sofas, beds and coffee tables.
How was the product type assigned?
By the product on the first page where each shopper saw the 3D button, using the page address and the site's own Google Analytics product categories.
Can I use these figures?
Yes, with a link to this page as the source. The figures for each product type are available as a CSV file on this page.