3D for e-commerce8 min read
AI-Assistant Shoppers Add to Cart More Often: 9 of 11 Shops
At 9 of 11 web shops, visitors from ChatGPT and other AI assistants added to cart more often than Google organic visitors. 60,955 sessions, Jan to Oct 2026.
By CharpstAR · 17 Nov 2026
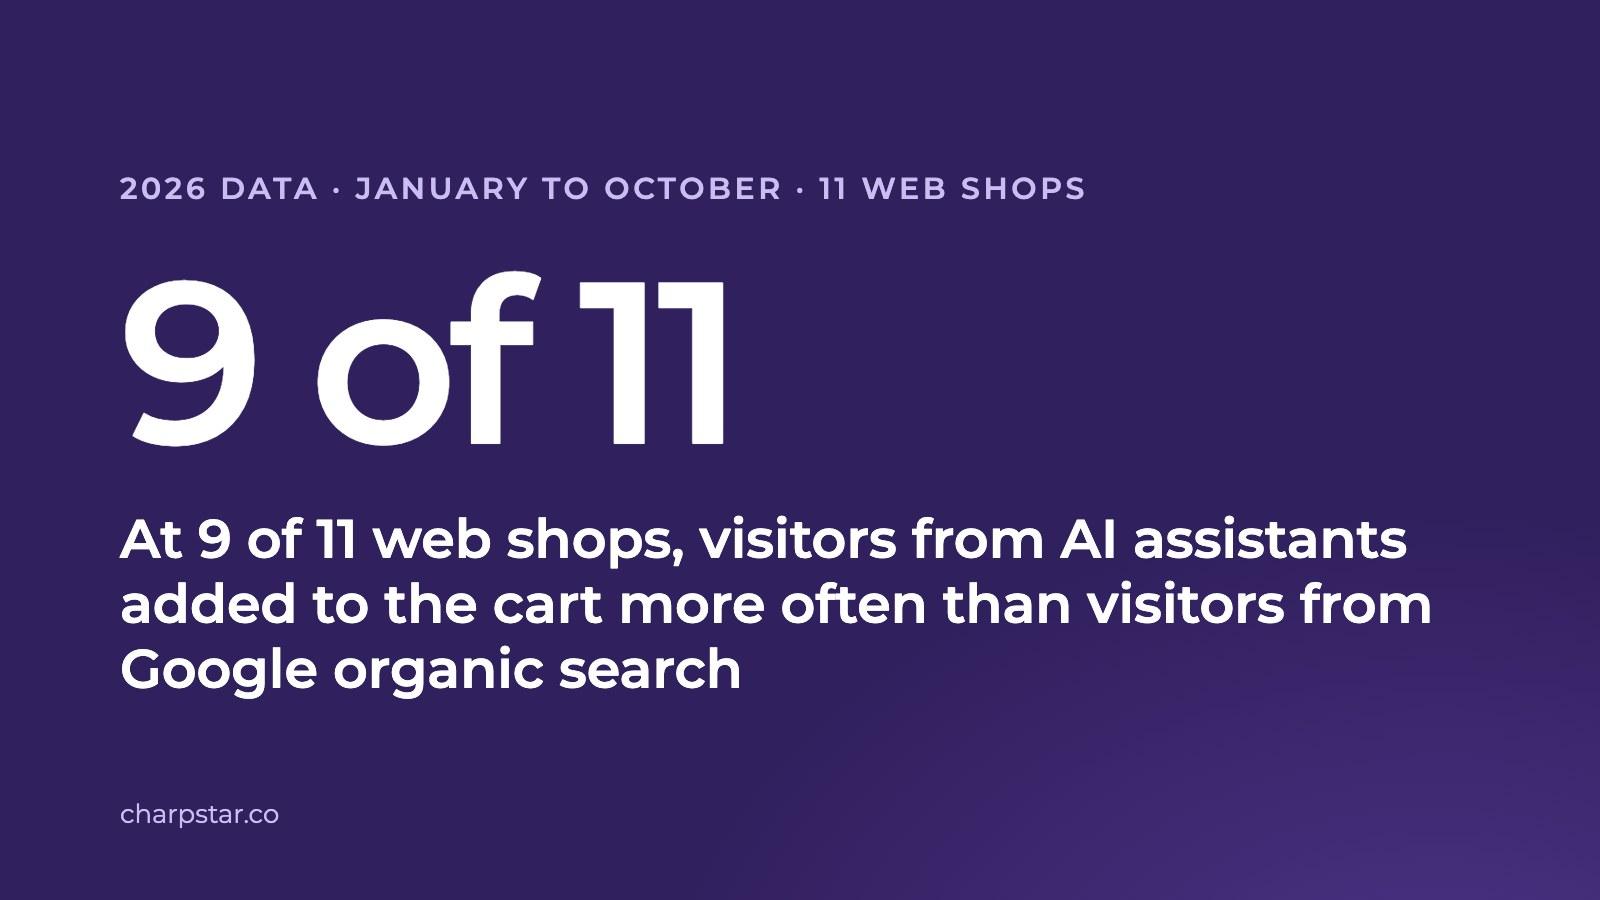
Visitors who arrived from ChatGPT, Perplexity, Gemini, Copilot or Claude added a product to the cart more often than visitors from Google organic search at 9 of the 11 web shops analysed. They were 0.57% of all sessions in October 2026, up from 0.17% in January and down from 0.82% in September. CharpstAR analysed the Google Analytics 4 data of 11 web shops from 1 January to 31 October 2026, 60,955 sessions from AI assistants in all, and compared them with Google organic sessions at the same shop.
1. AI Assistants Sent 0.57% of Sessions in October 2026, Down From 0.82% in September

Sessions from AI assistants were 0.17% of all sessions at the 11 shops in January 2026 and 0.82% in September. In October the share fell to 0.57%, and it fell at 10 of the 11 shops. ChatGPT accounted for 96% of the 60,955 sessions, Gemini for 1.9%, Perplexity for 1.1%, Copilot for 1.0% and Claude for 0.3%.
2. Visitors From AI Assistants Landed on a Product Page More Often at 8 of 11 Shops

A session counts as landing on a product page when its first page was a product page (the exact rule is in the methodology). At the outdoor equipment shop, 84.5% of sessions from AI assistants started on a product page, compared with 50.2% of Google organic sessions. At the lighting shop the figures were 71.1% and 28.9%, and at the sauna shop 70.5% and 31.2%.
At the furniture shop the two groups were level, at 70.6% and 72.0%, and at two of the three B2B office furniture sites AI visitors landed on a product page as often as Google organic visitors or slightly less often.
3. Visitors From AI Assistants Added to Cart More Often at 9 of 11 Shops

At the outdoor equipment shop, 8.27% of sessions from AI assistants included an add to cart, compared with 3.33% of Google organic sessions. At the sauna shop the figures were 8.52% and 3.44%, and at the water sports shop 6.30% and 2.99%. At the rugs shop the two groups were level, at 4.36% and 4.32%. The home furnishings shop was the one where AI visitors added to cart less often, at 1.08% against 2.24%. It had two orders from AI visitors in the ten months.
4. Purchase Rates at the Six Shops With at Least 50 Orders From AI Visitors
| Shop sells | AI visitors bought | Google organic visitors bought | Orders from AI visitors |
|---|---|---|---|
| Outdoor equipment | 4.17% | 2.06% | 316 |
| Lighting | 1.57% | 0.77% | 78 |
| Water sports equipment | 2.14% | 1.63% | 117 |
| Furniture | 0.81% | 0.58% | 62 |
| Rugs | 0.97% | 0.94% | 67 |
| Electric scooters and bikes | 1.78% | 1.71% | 379 |
Six shops had at least 50 orders from AI visitors in the ten months. At those six, the share of sessions that ended in a purchase ranged from level with Google organic visitors, at the rugs shop and at the electric scooters and bikes shop, to twice as high, at the outdoor equipment shop and the lighting shop. The average order was 3% to 22% lower for AI visitors at five of the six shops and higher at the rugs shop, at USD 318 against 269. The other five shops, the sauna shop, the home furnishings shop and the three B2B sites, had 2 to 15 orders from AI visitors, too few to compare.
5. Devices Were the Same and 3D Use Was Mixed
- Devices: phones were 80% of sessions from AI assistants and 79% of Google organic sessions.
- 3D and AR use: among sessions that reached a product page with 3D, AI visitors opened the 3D view or AR more often at three shops (outdoor equipment 9.5% against 6.8%, water sports 4.1% against 3.2%, furniture 4.9% against 3.5%) and less often at three (rugs 1.6% against 2.0%, electric scooters and bikes 1.5% against 2.5%, home furnishings 3.3% against 4.5%).
Methodology
- Sessions from AI assistants: GA4 sessions whose last-click source, or the referrer of the first page view, contained ChatGPT, OpenAI, Perplexity, Gemini, Copilot or claude.ai. Assistants that open links without passing a referrer are counted as direct traffic, so these figures are a minimum.
- Google organic sessions: sessions with the source google and the medium organic at the same shop.
- Landed on a product page: a product view within 15 seconds of the first page view of the session.
- Added to cart and bought: at least one add-to-cart event, or at least one purchase event, in the session. Rates are per session.
- Average order: purchase revenue per purchase, in US dollars as converted by GA4. Orders are compared within each shop, as the shops trade in different currencies.
- 3D and AR use: sessions in which the 3D or AR button was clicked, as a share of sessions that loaded a product page with 3D. Two shops open the 3D view without a click and are left out of that comparison.
- Share of sessions by month: sessions from AI assistants divided by all sessions of the 11 shops in that month.
- Sessions: as counted by GA4, for shoppers who consented to analytics cookies.
What This Means for Your Product Pages
At 10 of the 11 shops, more than half of the sessions from AI assistants started on a product page. For those visitors a product page is the first page of the shop they see.
A 3D viewer shows the product from all sides at its stated size, and AR places it in the shopper's room. CharpstAR builds the 3D models from your existing product photos and measurements. The viewer is added to product pages with one line of code on Shopify, Shopware, Magento, WooCommerce or a custom platform. It supports AR on iPhone and Android and sends its events to your Google Analytics, where the same comparison can be run for your own shop.
A 3D viewer with AR starts at $10 per product variant per month on the Basic plan (minimum 100 variants, 12-month term, implementation included). A 3D configurator for colour and material options starts at $20 per model per month on the Value plan (minimum 100 models, 24-month term). Both include the models, hosting and updates. See pricing and case studies. The first product is built free of charge within ten working days; send us a product and we reply within a working day. For how shoppers who used 3D or AR bought in 2026, see the shopper statistics and the figures by product type.
Questions
What share of web shop visits came from AI assistants in 2026?
0.57% of all sessions at the 11 shops in October 2026. The share was 0.17% in January and 0.82% in September, and it fell in October at 10 of the 11 shops.
Which AI assistant sent the most visitors?
ChatGPT, with 96% of the 60,955 sessions from AI assistants. Gemini followed with 1.9%, Perplexity with 1.1%, Copilot with 1.0% and Claude with 0.3%.
Did visitors from AI assistants buy more often than Google organic visitors?
At the six shops with at least 50 orders from AI visitors, their purchase rate ranged from level with Google organic visitors to twice as high. Their average order was lower at five of the six shops.
Why are these figures a minimum?
An assistant that opens a link without passing a referrer shows up in Google Analytics as direct traffic. Those sessions cannot be told apart from shoppers who typed the address, so they are not counted here.
Can I use these figures?
Yes, with a link to this page as the source. The figures for each shop are available as a CSV file on this page.