3D for e-commerce11 min read
Which Products Need 3D First: Type Matters More Than Price
Shoppers at 7 web shops opened 3D far more often on tents, kayaks and sauna cabins than on accessories. Dearer products were opened more at only 4 of the 7.
By CharpstAR · 17 Nov 2026
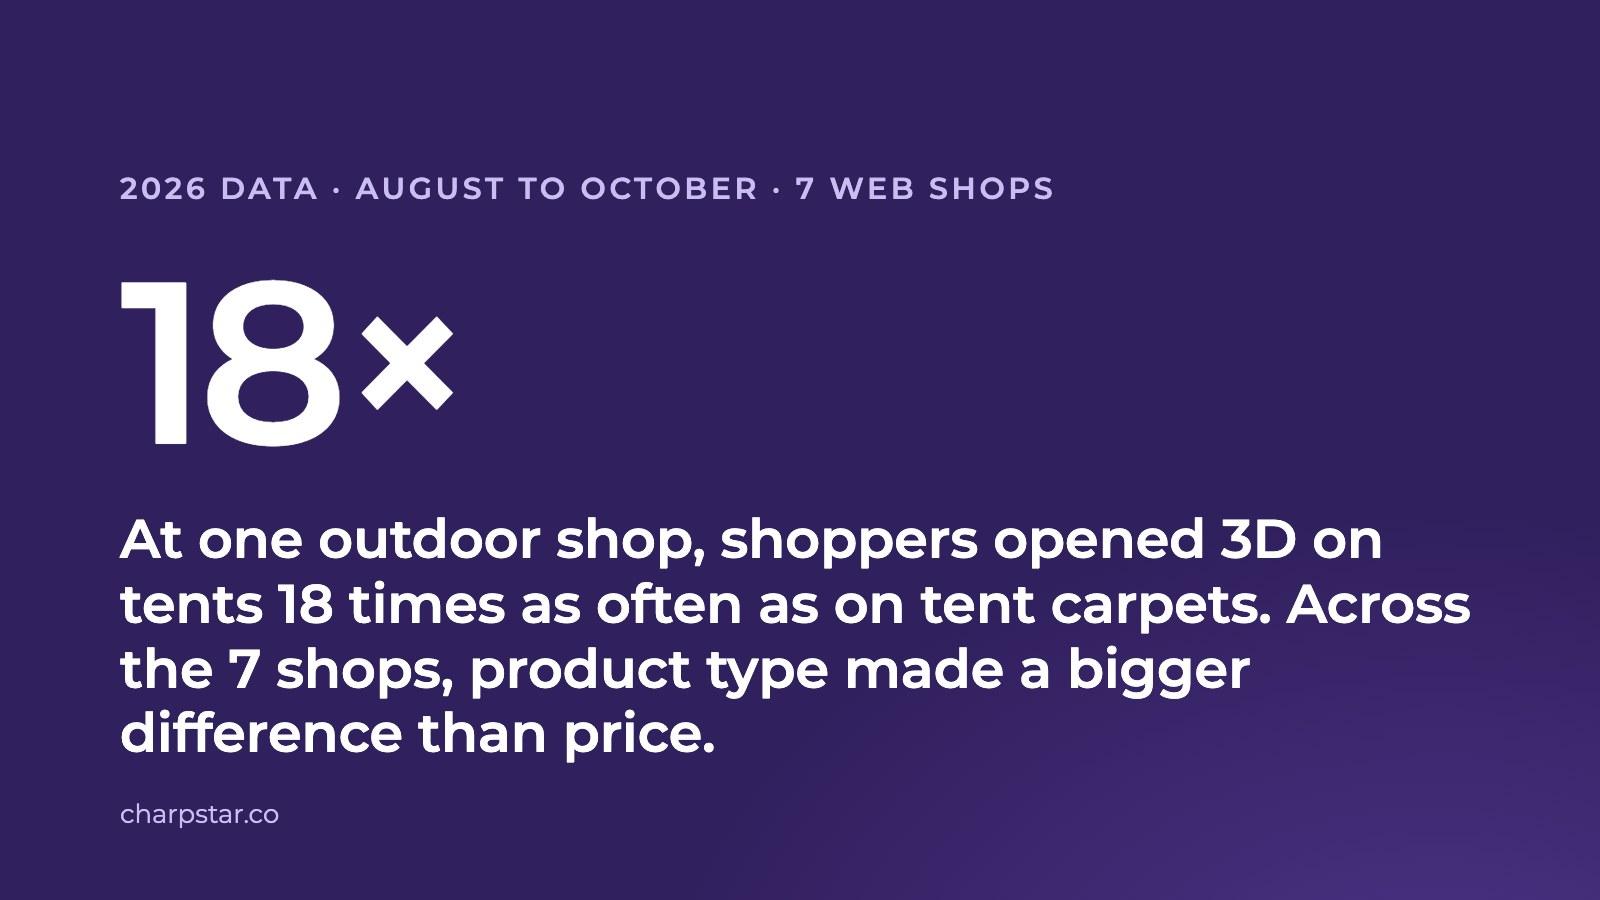
Shoppers opened the 3D view or AR on tents, kayaks and sauna cabins many times as often as on tent carpets, accessories and heaters sold by the same shop. At four of the seven shops analysed, the dearest third of products was opened more often than the cheapest third. At the other three it was not. CharpstAR analysed the Google Analytics 4 data of seven web shops from 1 August to 31 October 2026, about 2.96 million product page views on products that had 3D, and compared open rates within each shop by product type, by price and by how often the product was viewed.
1. Tents, Kayaks and Sauna Cabins Had the Highest Open Rates

At the outdoor equipment shop, 3.3% of product page views for tents included an open of the 3D view. Air tents were at 3.1% and gazebos at 2.2%. Tent carpets, sold on the same site, were at 0.18%, and air beds and mattresses under 0.1%.
At the water sports shop, fishing kayaks had the highest open rate of any product type in the data, at 7.1%. Kayaks followed at 4.0%, gym equipment at 3.4% and sea kayaks at 2.9%. Paddle boards were at 1.1%, accessories at 0.4% and electric bikes at 0.2%.
At the sauna shop, which counts AR opens, sauna cabins were at 1.9%, barrel saunas at 1.7% and saunas at 1.3%. Hot tubs were at 0.5%. Sauna heaters and cold plunge pools were under 0.1%.
2. Scooters, Dining Furniture and Candle Holders Led at the Other Three Shops

At the scooter and e-bike shop, electric scooters were opened in 3D on 1.6% of product page views, electric bikes on 0.1%, and accessories and spare parts on under 0.1%. Electric bikes had a low open rate at both shops that sell them, 0.1% here and 0.2% at the water sports shop.
At the furniture shop, dining and living room furniture were at 1.2%, bedroom furniture at 1.0% and outdoor furniture at 0.6%. At the lighting shop, which counts AR opens, advent candle holders were at 0.5%, table lamps at 0.3%, ceiling and wall lamps at 0.2% and floor lamps at 0.1%. Hanging decorations and window lamps were under 0.1%.
3. The Dearest Third Was Opened More Than the Cheapest at Four of Seven Shops

Each shop's 3D products were split into thirds by price. At four shops the dearest third was opened more often than the cheapest third: the outdoor equipment shop at 0.1%, 2.0% and 2.5% from cheapest to dearest, the furniture shop at 0.7%, 1.2% and 1.5%, the scooter and e-bike shop at under 0.1%, under 0.1% and 1.0%, and the sauna shop at under 0.1%, 1.5% and 1.3%.
At the other three shops price did not order the open rates. At the rugs shop every third was at 0.3%. At the lighting shop the middle third was highest, at 0.1%, 0.4% and 0.2%. At the water sports shop the cheapest third was highest, at 2.0%, 0.3% and 0.5%, because its cheapest 3D products are kayaks and its dearest are electric bikes.
4. The Most-Viewed Fifth of Products Took Most of the Opens

The fifth of each shop's 3D products with the most page views took 54% to 100% of the shop's opens at six of the seven shops. At the outdoor equipment shop those products had 57% of the views and 77% of the opens. At the scooter and e-bike shop they had 94% of the views and 100% of the opens, and at the furniture shop 64% and 70%.
The water sports shop was the exception. Its most-viewed fifth, mostly electric bikes, had 80% of the views and 36% of the opens. The kayaks, which shoppers opened far more often, sit further down its list by views.
5. Open Rates by Shop
| Shop sells | Counts | Highest product type | Lowest product type | Cheapest, middle, dearest third | Most-viewed fifth, share of opens |
|---|---|---|---|---|---|
| Outdoor equipment | 3D opens | Tents 3.3% | Air beds and mattresses under 0.1% | 0.1%, 2.0%, 2.5% | 77% |
| Water sports equipment | 3D opens | Fishing kayaks 7.1% | Electric bikes 0.2% | 2.0%, 0.3%, 0.5% | 36% |
| Saunas | AR opens | Sauna cabins 1.9% | Cold plunge pools under 0.1% | under 0.1%, 1.5%, 1.3% | 54% |
| Electric scooters and bikes | 3D opens | Electric scooters 1.6% | Accessories and spare parts under 0.1% | under 0.1%, under 0.1%, 1.0% | 100% |
| Furniture | 3D opens | Dining furniture 1.2% | Outdoor furniture 0.6% | 0.7%, 1.2%, 1.5% | 70% |
| Lighting | AR opens | Advent candle holders 0.5% | Hanging decorations and window lamps under 0.1% | 0.1%, 0.4%, 0.2% | 74% |
| Rugs | 3D opens | Rugs 0.3% (the only type) | Rugs 0.3% (the only type) | 0.3%, 0.3%, 0.3% | 74% |
Methodology
- Products: products that had the CharpstAR 3D viewer or AR on their page between 1 August and 31 October 2026, at seven web shops. Products without 3D are not in the data, so the comparison is between products the shops had already chosen to model.
- Open rate: clicks on the 3D button, as a share of product page views for that product. An open is counted for the last product viewed in the session before the click. At the lighting shop and the sauna shop the 3D view opens by itself, so the AR button is counted there.
- Product type: the shop's own product category, as sent to GA4 with the product view. Categories with fewer than 1,500 views in the period are left out.
- Price thirds: each shop's 3D products ranked by price in US dollars as converted by GA4 and split into three equal groups. Thirds are compared within a shop only.
- Most-viewed fifth: each shop's 3D products ranked by product page views; the top fifth's share of views and of opens.
- Left out: an eighth consumer shop whose opens could not be tied to products, and three B2B sites. Views and opens are as counted by GA4, for shoppers who consented to analytics cookies.
How to Choose the First Products for 3D
The shops in this data opened 3D most on products that are large, that go in a room, a garden or on the water, and that are hard to judge from a photo: tents, kayaks, sauna cabins, dining and living room furniture, electric scooters. Open rates on accessories, spare parts, heaters and carpets were at 0.4% or less at every shop that sells them.
For a shop deciding where to start, the data points to three steps.
- Pick the product types first. Start with the types that had the highest open rates in this data: furniture, tents and gazebos, kayaks, sauna cabins and barrel saunas, electric scooters. Leave accessories, spare parts and small add-ons for later.
- Within those types, take the most-viewed products. At six of seven shops the most-viewed fifth of 3D products took 54% to 100% of the opens. Take the list from your product page views for the last three months.
- Use price as a check. The dearest third was opened more often at four of seven shops, and at the other three price made no difference or ran the other way.
CharpstAR builds the 3D models from your product photos and measurements and adds the viewer to your product pages with one line of code on Shopify, Shopware, Magento, WooCommerce or a custom platform. The viewer supports AR on iPhone and Android and sends its events to your Google Analytics, where the same open rates can be read for your own shop.
A 3D viewer with AR costs from $10 per variant per month on the Basic plan, for at least 100 variants on a twelve-month term, with implementation included. A 3D configurator for colour and material options costs from $20 per model per month on the Value plan, for at least 100 models on a 24-month term. Both include the models, hosting and updates, and there are no setup fees. See pricing and case studies. The first product is built free. Send us a product and we reply within a working day. For how shoppers who used 3D or AR bought in 2026, see the shopper statistics and the figures by product type.
Questions
Which products did shoppers open in 3D most often?
Fishing kayaks, at 7.1% of product page views, then kayaks at 4.0%, gym equipment at 3.4%, tents at 3.3% and air tents at 3.1%. Among AR opens, sauna cabins led at 1.9%.
Which products were hardly opened?
Accessories, spare parts, sauna heaters, tent carpets, air beds, hanging decorations and window lamps were at 0.4% or less at the shops that sell them. Electric bikes were at 0.1% and 0.2% at the two shops that sell them.
Do expensive products get opened more often?
At four of the seven shops the dearest third of 3D products was opened more often than the cheapest third. At the rugs shop every third was level, at the lighting shop the middle third was highest, and at the water sports shop the cheapest third was highest because its cheap products are kayaks.
Why does the data start from products that already have 3D?
Open rates can only be measured on products with a 3D viewer or AR on the page. The seven shops had already chosen which products to model, so the comparison is between those products and says nothing about products that were never modelled.
Can I use these figures?
Yes, with a link to this page as the source. The figures for each shop and product type are available as a CSV file on this page.