Furniture and home4 min read
Augmented reality furniture retail market: checked figures
The AR furniture market figures that are published in full, with their sources, and what they mean for a mid-size furniture brand.
By CharpstAR · 25 Sept 2023 · Updated 30 Sept 2026
Part of Augmented reality for furniture retail: the complete guide
Most of the dollar figures for the augmented reality furniture retail market come from reports that have to be bought, published by the firms that sell them. The figures below are the smaller set that are published in full and that a furniture brand can put into its own planning.
The returns figures
AR is sold mainly as a way to cut returns, and the figures for returns are public.
The National Retail Federation, with Appriss Retail, put total United States retail returns at 743 billion dollars of merchandise in 2023, a return rate of 14.5 percent of sales. The online rate is higher at 17.6 percent, which is 247 billion dollars of merchandise bought online and sent back.
For furniture, the rate understates the cost. Collecting a returned sofa takes two people and a van, it has to be inspected in the warehouse, and it's often sold as a second afterwards. So a furniture retailer with a low return rate can still lose more per return than a clothing retailer with a much higher one.
What the conversion figures measure
Shopify reported in September 2020 that products with 3D or AR content converted 94 percent more often than comparable products without it, across merchants on its platform.
Merchants who pay for a 3D model of a product usually improve that product's page in other ways too, and some of the 94 percent is down to which products the merchants chose to model.
The results from named merchants are more specific.
| Merchant | Result | Category |
|---|---|---|
| Rebecca Minkoff | Shoppers 44 percent more likely to add to cart after viewing a product in 3D | Fashion accessories |
| Rebecca Minkoff | 65 percent purchase lift on AR-enabled product pages | Fashion accessories |
| Rebecca Minkoff | 27 percent more likely to place an order after interacting in 3D | Fashion accessories |
| Gunner Kennels | Return rate reduced by 5 percent | Hard goods |
| Oakywood | Roughly 200 to 300 custom orders a month, from almost none, after adding 3D customisers | Desk accessories |
None of the merchants in that table is a furniture brand. Public evidence for furniture itself is thin, and a furniture figure quoted without a named merchant is usually one of these numbers passed on without its source, or one from a paid report.
The fall in the cost of offering AR
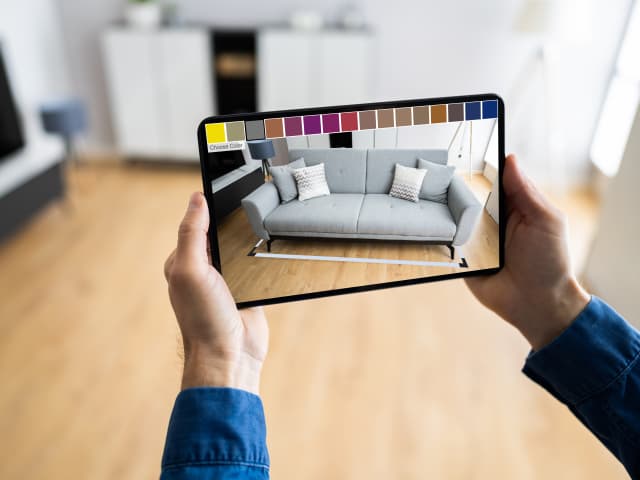
The largest change in furniture AR is in the cost of deploying it. Both phone platforms open a 3D model in the camera view from a link on a web page, so what the retailer pays for is the model and a button in the product page template.
On the demand side, Shopify cites research finding that 58 percent of customers use AR before making a purchase and that 30 percent of consumers use AR for online shopping and virtual try-ons, with 61 percent of those using a mobile device. These come from third-party surveys in which people report their own behaviour.
What the figures mean for a mid-size furniture brand
For a brand selling a few hundred to a few thousand furniture SKUs, we read the figures as follows.
A 3D model produces the interactive viewer, the phone AR placement and still renders for category pages, email and ads. If those renders replace a photo shoot you were already paying for, the model has paid for itself before any conversion effect shows.
A furniture return costs so much in freight that even a small reduction matters, and the public data on it is thin. Gunner Kennels' 5 percent is the only published return figure of this kind that can be checked, and Gunner Kennels doesn't sell furniture, so you'll have to measure your own.
On conversion, the merchant results above point the same way; expect less than 94 percent on your own catalogue for the reasons given.
A furniture example from our own work
At Sweef, modular sofas went into a configurator with AR placement, so a customer can see whether the combination they have put together fits the room before ordering it.
Measuring the effect on your own catalogue
Base your budget on a figure from your own catalogue. Take five products and record their conversion rate, add-to-cart rate and return rate for the previous quarter. Add accurate models and an AR button, change nothing else, and compare after the next quarter.
The first model is free, so send us one product to start the comparison. The solutions page sets out the full service and the prices page has the monthly cost per product.
Sources
- National Retail Federation and Appriss Retail, 2023 Consumer Returns in the Retail Industry.
- Shopify, merchant data on 3D and AR content, September 2020.
- Shopify, AR shopping, including Rebecca Minkoff, Gunner Kennels and AR usage figures.
- Shopify, 3D ecommerce guide, including the Oakywood results.