3D for e-commerce4 min read
How a 3D product page reduces customer service questions
Which pre-sale questions a 3D viewer answers on the page, which ones still need copy, and how to measure the drop in contacts against a control set.
By CharpstAR · 4 Oct 2023 · Updated 9 Oct 2026
Customer service teams in retail answer the same pre-sale questions over and over, and most of them are questions the product page could have answered. They arrive by email, chat and phone, and behind each one is a person who wanted to buy something and couldn't find enough information to decide. Most shoppers with the same question never ask it. They leave, and the only trace is a lower conversion rate.
The questions that come in, sorted by whether 3D helps
Pull a month of pre-sale contacts and tag them. In the furniture, home and hard-goods queues we have seen, the distribution looks like this.
| Question type | Typical wording | Does a 3D page remove it |
|---|---|---|
| Size and fit | "Will this fit in a 2.4 metre alcove" | Yes, with dimension lines and AR at true scale |
| What it looks like elsewhere | "What does the back look like, is it finished" | Yes, rotation shows it directly |
| Colour and finish | "Is the grey more blue or more beige" | Partly, a render is closer than a photo but is not a colour match |
| Material and texture | "Is this real oak veneer or a print" | Partly, needs a macro photograph alongside |
| Configuration | "Can I have the chaise on the left" | Yes, in a configurator |
| Assembly and parts | "Does it come flat packed, how many boxes" | No, this is page copy |
| Stock and delivery | "When would this arrive" | No |
| Price, discounts, warranty | "Is there a discount if I order two" | No |
The top half of that table is visual, and a model can answer it. The bottom half is text and data, and a 3D viewer doesn't change any of it. A large share of any real queue is about delivery, stock and price, so a viewer only reaches part of the queue.
Size is the biggest category
Size is the largest category in almost every queue we have seen, because dimensions on a page are numbers and most people can't picture a number. "Width 212 cm" gives the shopper the full information and still leaves them unsure whether it fits the alcove.
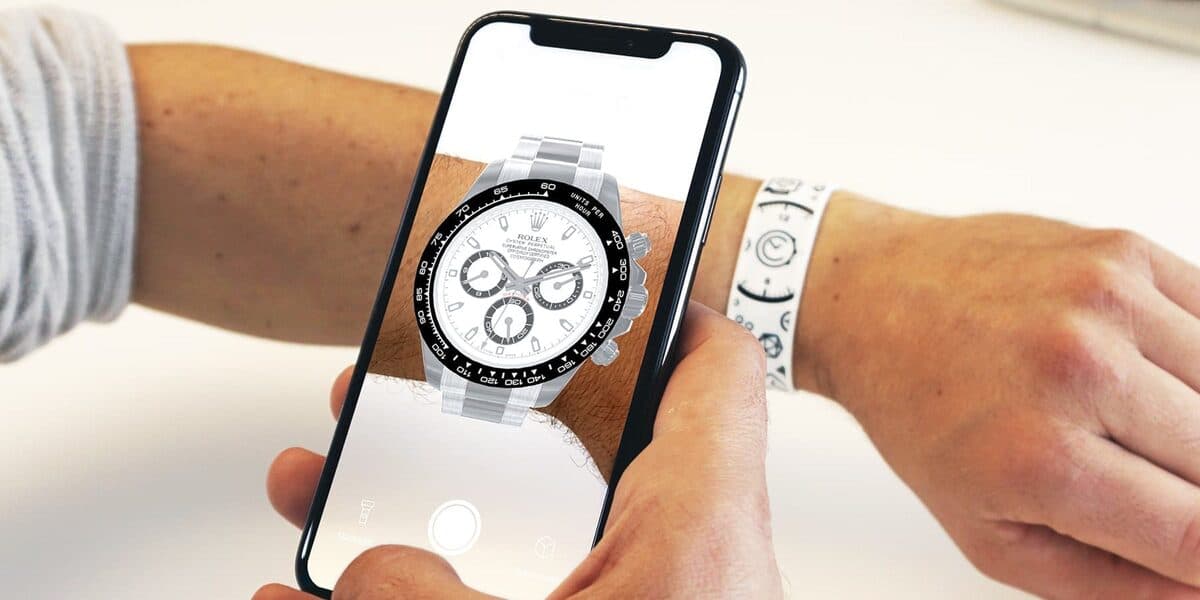
Dimension lines drawn on the 3D model put each measurement on the part of the object it refers to, which also settles the follow-up about whether the width includes the arms. AR placement at true scale lets the shopper check whether it fits between the window and the door. Both phone platforms do this from the browser.
The second-largest category is usually "what does the back or underside look like", and it comes down to photography. Product shoots cover the hero angles. Shoppers who plan to put a bookcase in the middle of a room, or a desk against a window, need the angles the shoot skipped, and rotation covers all of them.
Configuration questions go the same way when the product is modular. Sweef put its modular sofa into a configurator that shoppers can build up and place in their room, so whether a particular combination fits is settled on the shopper's phone before it reaches support.
The questions 3D doesn't remove
Agree these at the planning stage. A render gets close on colour, but screens differ, so a customer matching a grey to an existing sofa will still ask. Offer fabric samples and say so on the page. Delivery windows, assembly, weight, warranty and the staircase question are copy and data problems. If clear delivery and assembly information isn't on the page yet, publish it before commissioning any models; in the queues we have looked at it removes more contacts per hour of work.
How to measure the reduction
Ticket volume on its own won't tell you, because it moves with traffic, season, promotions and product mix. This is the method we suggest.
- Tag contacts by product and by reason. Use a short fixed list: size, appearance, material, configuration, delivery, stock, other. Do this for a month before you change anything.
- Normalise by traffic. The metric is contacts per thousand sessions on that product page, or contacts per hundred orders. Absolute ticket counts rise and fall with traffic.
- Compare products within the same period. Pick a set of products that get a 3D viewer and a comparable set that don't, matched on price and category. Both sets run through the same season, the same promotions and the same traffic conditions. Then compare the size-and-appearance contact rate between the two sets. This is the closest thing to a controlled test that most retailers can run.
- Watch the leading indicators too. Interaction rate with the viewer, AR open rate, and the conversion difference between sessions that interacted and sessions that didn't. These move faster than ticket volume and will show within a fortnight whether anyone is using the viewer.
- Record returns for both sets, with the stated reason. A shopper who didn't ask about size may order anyway and send it back.
Published figures
We haven't found a published figure for support ticket reduction after adding 3D. The nearest published result sits downstream of the same mechanism: Shopify reports that Gunner Kennels cut its return rate by 5 percent after adding 3D and AR to its product pages.
Which product to test first
You probably already know which product generates the most email. Put a model on that page and tag your contacts for a month either side. We model the first product free if you want to run that test (free sample).
Sources
- Shopify, AR shopping: the Gunner Kennels result.