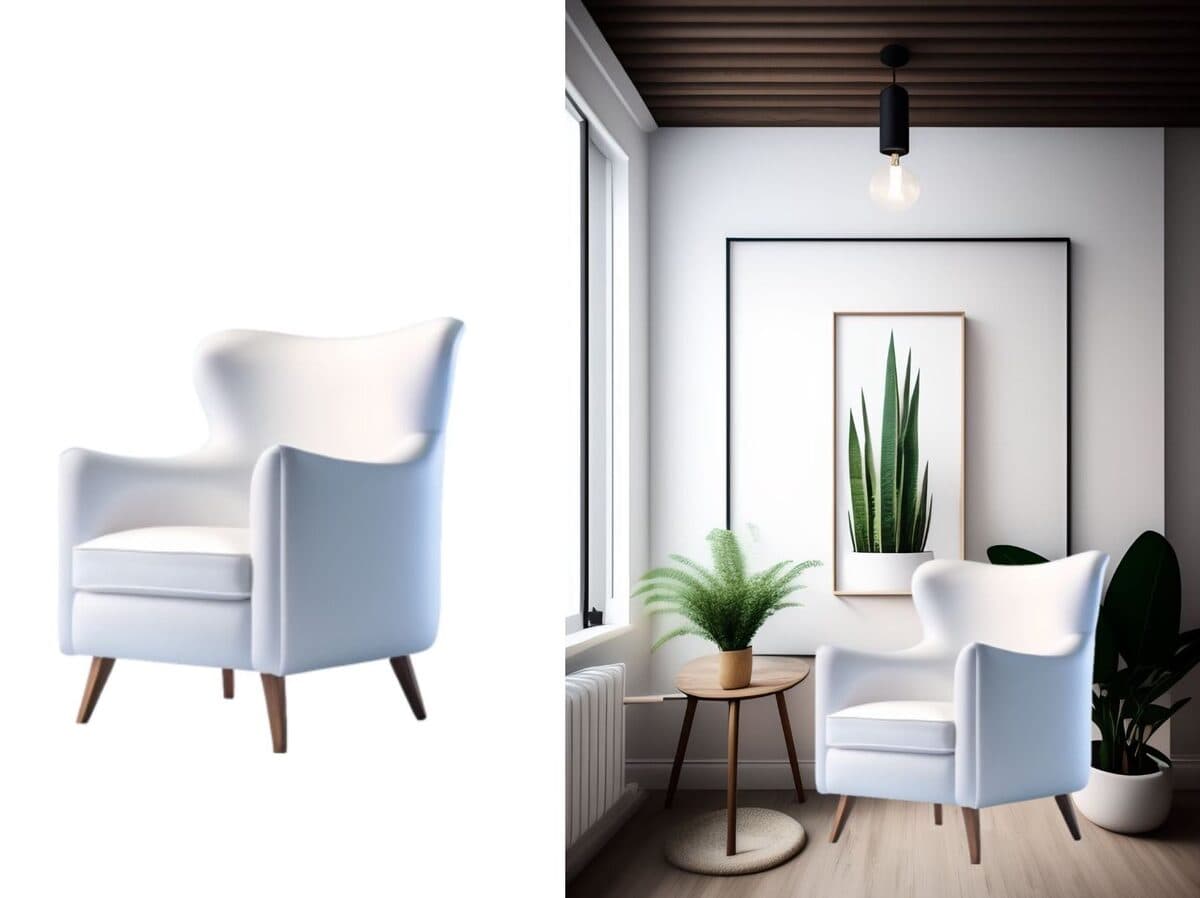
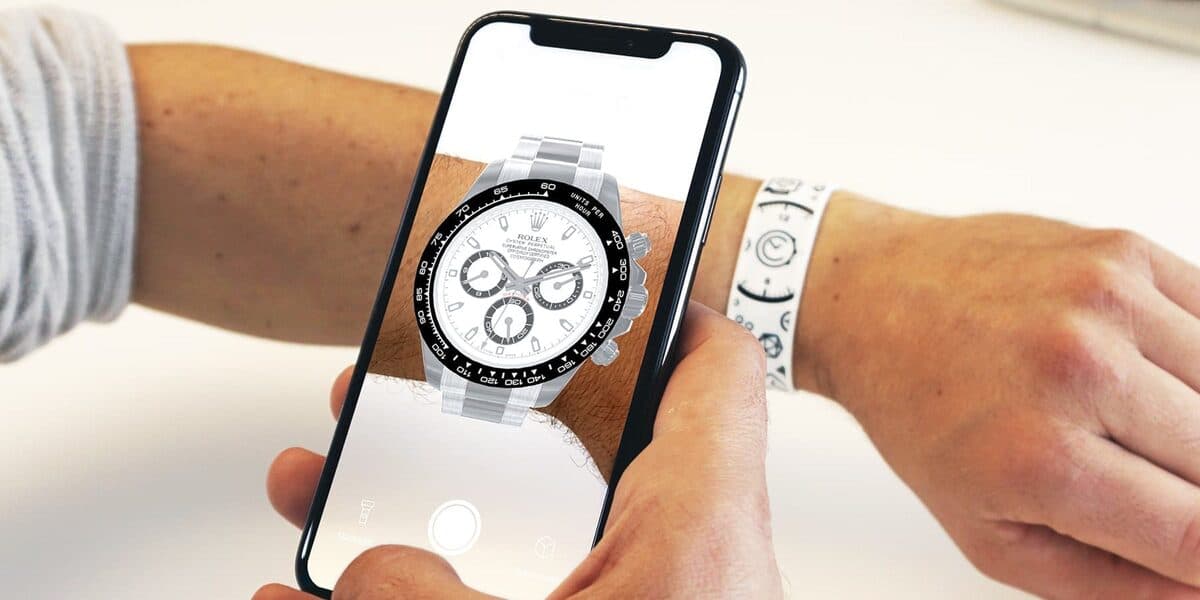
3D for e-commerce5 min read
Does AR reduce returns? Where the numbers come from
The AR returns numbers everyone quotes, where they come from, how they were measured, and what you can reasonably expect in your own category.
By CharpstAR · 21 Mar 2023 · Updated 9 Oct 2026
Part of Augmented reality for furniture retail: the complete guide

A 40 percent cut in returns is the figure most often quoted for AR in e-commerce. We sell 3D and AR, so it would suit us if the number held up as stated. Below is where it comes from, how each of the figures around it was measured, and what a brand selling furniture or home goods can expect from its own range.
How much comes back
The National Retail Federation and Appriss Retail put returned merchandise in the United States at 743 billion dollars in 2023, which is 14.5 percent of retail sales. Online runs higher than the average. 17.6 percent of e-commerce sales came back, against 10.02 percent in store. That gap between online and in-store is what AR is meant to narrow, and unlike most of what follows it has been measured properly.
The numbers people quote
| Claim | Source | What it is |
|---|---|---|
| 40 percent fewer returns with 3D visualization | Shopify, via AR Insider | A merchant-reported figure, no methodology published |
| 25 percent fewer returns on AR-guided purchases | SeekXR, via AR Insider | Vendor's own reporting on its own customers |
| Return rates 22 percent lower than non-AR benchmarks | Build.com, via AR Insider | Retailer-reported, comparison group unspecified |
| 5 percent reduction in returns | Gunner Kennels, via Shopify | Single merchant, one product category |
| Under 2 percent returns against a 5 to 7 percent industry norm | Macy's in-store VR, via AR Insider | In-store VR rather than e-commerce AR, so a different shopping context |
All five can be cited. None comes from a controlled experiment, and they share the same weaknesses.
Self-selection. The shoppers who open an AR viewer are not a random sample. They are more engaged, further along in deciding, and more likely to have talked themselves into it already. Those shoppers return less than average whatever the AR showed them. Comparing AR users to non-users measures the difference between two kinds of shopper at least as much as it measures the effect of AR.
No control group. Almost all of these compare before and after, or AR viewers against everyone else, rather than randomly assigning shoppers to see AR or not see it. Seasonality, a catalogue change or a new returns policy in the same period would produce the same chart.
Publication bias. Merchants and vendors publish the results that went well. The pilots that moved nothing do not get a case study.
The numbers are not wrong. They support a direction better than they support any particular percentage.
What is better evidenced
The conversion side of the argument has more behind it than the returns side. Shopify's 2020 merchant data across its platform found that interactions with products carrying 3D or AR content converted 94 percent more often than the same kind of products without. Rebecca Minkoff reported that shoppers were 44 percent more likely to add to cart after interacting with a product in 3D, 27 percent more likely to place an order, and that AR-enabled product pages saw a 65 percent purchase lift. The sample is large and the direction is consistent, and it is still an observational comparison rather than a randomised one.
There is also a mechanism, which matters when the statistics are shaky. Returns happen because the product that arrived differed from the product the shopper pictured. The two most common ways that happens are size and colour. AR at real scale removes the size error for anything spatial, and a good 3D model with accurate materials reduces the colour error. That is reasoning rather than a study, but it explains why an effect would exist at all.
Where to expect a reduction
Large furniture, appliances, stoves, home gym equipment, anything where the shopper has to guess whether it fits. This is where the mechanism is strongest and where a return is also most expensive, which doubles the value of any reduction. Size-related problems are, per the report Shopify cites, among the most common reasons products come back at all.
Smaller hard goods, where colour and material are the risk. A model with accurate materials helps, modestly.
Apparel sizing is where to expect the least. Virtual try-on for garments shows how a garment looks, and the size error it would need to remove depends on body measurements a phone camera does not take. A published size chart and fit notes drawn from your own returns data will do more, for far less money.
How to test it on your own catalogue
You can run a defensible test without a research team.
- Pick 20 to 40 products in one category with enough volume to see a difference, and enough return history to have a baseline.
- Build 3D and AR for half of them, chosen at random within the set rather than the best sellers.
- Leave it running for a full quarter so seasonality applies to both groups equally.
- Compare return rate rather than return count between the two groups. Also compare conversion, because that is where the larger effect usually is.
- Segment the AR group by whether the shopper opened the viewer, but treat that split as descriptive. The headline comparison has to be the whole group against the whole group, or you have brought self-selection back in.
It is enough to answer the question for your own products.
What to expect
AR probably reduces returns for products where fitting a real space is the buying risk, by an amount nobody has measured rigorously. It increases conversion more reliably. Both come from the same cause, which is that shoppers decide better with better product information, and that second effect is the stronger reason to build 3D and AR. A fall in returns on top of it is welcome, but the business case should not depend on it.
If you want to run the test above, the models are the only real cost. We will build the first one free so you can see the quality before committing to a set. Free sample here, and per-product pricing is on prices.
Sources
- National Retail Federation and Appriss Retail, 2023 Consumer Returns in the Retail Industry.
- AR Insider, Does AR really reduce e-commerce returns?, which collects the Shopify, SeekXR, Build.com and Macy's figures.
- Shopify, merchant data on 3D and AR content, September 2020.
- Shopify, AR shopping: Rebecca Minkoff and Gunner Kennels results.
- Shopify, 3D ecommerce.