Furniture and home6 min read
The pre-season checklist for outdoor and summer ranges, month by month
A working timeline for getting an outdoor range ready: stock, content, 3D, ads and the deadlines you cannot move. Built around a short selling season.
By CharpstAR · 4 Oct 2023 · Updated 22 Sept 2026
Outdoor and summer ranges have an unforgiving shape. Most of the year's revenue arrives in a window of a few weeks, the window opens when the weather decides rather than when your calendar does, and anything not ready on the first warm weekend is effectively not ready at all.
The mistake that costs the most is not a bad campaign. It is a timing failure: content commissioned too late, a shoot that slipped, a product page that went live with placeholder images in week two of a six-week season. This is an operational checklist for avoiding that, organised by when the work has to happen rather than by how important it feels.
Work backwards from the first warm weekend, not from the campaign date
Every plan for a seasonal range should be anchored to one date, and it is not the launch date on the marketing calendar. It is the first weekend of good weather in your main market, because that is when demand actually appears. You cannot predict it precisely, but you know roughly when it could start, and you should plan to be finished before the earliest plausible date rather than the average one.
Take that date. Everything below is counted backwards from it.
| When | What has to be done | Why it cannot slip |
|---|---|---|
| 6 months before | Range locked, quantities committed, supplier lead times confirmed | Everything downstream depends on knowing what you are selling |
| 5 months before | Content brief written for every SKU, gaps identified | You cannot commission what you have not listed |
| 4 months before | 3D models and photography commissioned | This is the long-lead item, and the one people start too late |
| 3 months before | Product data complete: dimensions, materials, care, assembly, weight | Copy and feeds cannot be built without it |
| 2 months before | Pages built and staged, 3D viewers and AR live on staging | Leaves time to fix what breaks |
| 6 weeks before | Page speed tested on a real phone on cellular data | Slow outdoor pages fail exactly when traffic peaks |
| 4 weeks before | Ads built with the new assets, feeds validated, stock synced | Ad review and feed approval take longer than you think |
| 2 weeks before | Everything live, soft launch, fix what the first real traffic reveals | The season starts before you announce it |
The line that moves most often in real projects is the four-month one. Visual content is treated as a marketing task that can be squeezed, when it is actually the longest lead item on the list.
Why the content deadline is the hard one
For outdoor ranges, content has a dependency that indoor ranges do not: you cannot photograph a garden set outdoors in February in northern Europe and have it look like summer. So the choice is to shoot in a studio and lose the context, shoot abroad and pay for it, use last year's images and lose the new products, or build the range in 3D and render whatever setting you want in whatever weather you want.
3D also solves the ordering problem. Physical samples of a new outdoor range often arrive weeks before the bulk shipment, sometimes after the content deadline has passed. A model built from the manufacturer's CAD or drawings can exist before any sample lands, which is usually the difference between launching complete and launching with three products missing images.
Two further practical points. Variants are nearly free once a model exists, so a table in five finishes does not mean five shoots. And the same model feeds the product page viewer, the AR button, the ad creative, the email and the print catalogue, which is where the cost comparison against a shoot actually turns.
The AR and 3D part, sized correctly
Do not treat this as the whole project. Treat it as three specific jobs on a short list.
Dimension clarity on the page. Outdoor buyers are overwhelmingly making a size decision: will the table fit the balcony, does the parasol clear the railing, how much of the patio does the lounge set eat. A 3D viewer with dimension lines answers that before anyone opens a camera.
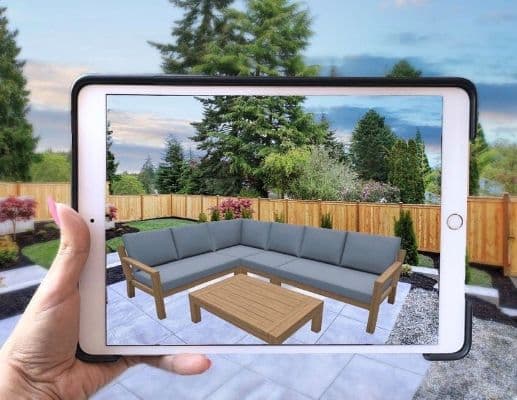
AR for the biggest items only. Placement at true scale from the browser works with no app on both platforms, through Scene Viewer on Android, where one unit in the file equals one metre, and AR Quick Look on iOS. It earns its keep on the large, expensive, freight-heavy items. It is wasted on a cushion.
Reuse of the assets everywhere else. Once the model exists, the render for the ad and the render for the catalogue cost a fraction of a shoot.
Keep expectations grounded on how many people use AR. Rotation in the viewer is the majority interaction on the pages we see. AR placement is a minority one, valuable for the item where size is the blocker.
The non-glamorous checks that decide the season
Page speed on a phone on mobile data. Outdoor shopping happens in gardens and on balconies, which means cellular connections. Shopify's 3D commerce guidance puts the ideal GLB at around four megabytes, with files over fifteen megabytes optimised automatically. Test your own pages on a throttled connection, not on office wifi.
Stock accuracy across channels. Nothing wastes a peak weekend like selling four hundred units of something you have ninety of.
Delivery expectations, stated. Bulky outdoor goods have long delivery windows, and a shopper who finds that out at checkout abandons. Put it on the product page.
Assembly information before purchase. For garden furniture this is a genuine return driver and it costs nothing to publish.
Returns policy for large items. Say what happens, who collects, and who pays. Vagueness here is what turns a hesitation into a lost sale.
Measuring it so next year is easier
Set the baseline before the season starts, because after it starts you will not have a clean comparison. The four things worth recording per product: conversion rate, return rate and stated reasons, pre-sale customer service contacts, and interaction rate with the 3D viewer if you have one. Then compare products with models against similar products without, in the same season, rather than comparing this year against last year where the weather is a confound.
On the general evidence, the figures most often cited are Shopify's. Their 2020 merchant data showed interactions with products carrying 3D or AR content converting 94 percent more often than the same kind of products without, which is a comparison rather than a controlled test. Their published Rebecca Minkoff and Gunner Kennels figures are more specific: 44 percent more likely to add to cart after a 3D interaction, 27 percent more likely to order, 65 percent purchase lift on AR pages, 5 percent return reduction at Gunner Kennels. And the reason returns are worth the attention at all: the National Retail Federation put United States returns at 743 billion dollars in 2023, 14.5 percent of sales and 17.6 percent online. Outdoor goods are heavy, so each one is expensive to take back.
The clients doing this well
Sweef built a configurator around modular pieces, which suits seasonal ranges because the combinations multiply faster than any shoot could cover. Contura uses true-scale placement for a product where the room decides the purchase. MELIMELI reuses one set of models across shop and campaign, which is exactly the economics a short season needs.
If your next season is more than four months away, you are at the point on the timeline where the content decision has to be made. We will build a 3D model of one of your products for free so you can judge it against your own photography before committing to a range. It is yours to keep. Send us one product, and see solutions and prices for the rest.
Sources
- Google, Scene Viewer documentation.
- Apple, AR Quick Look.
- Shopify, 3D e-commerce guide.
- Shopify, merchant data on 3D and AR content, September 2020.
- Shopify, AR shopping: Rebecca Minkoff and Gunner Kennels results.
- National Retail Federation and Appriss Retail, 2023 Consumer Returns in the Retail Industry.