3D for e-commerce4 min read
Does 3D increase online sales: the evidence checked
The 94 percent figure, the Rebecca Minkoff numbers and other published stats: what was measured, by whom, on what sample, and what you can conclude.
By CharpstAR · 4 Oct 2023 · Updated 22 Sept 2026
Part of 3D models for e-commerce: the complete guide
Almost every article about 3D commerce cites the same handful of numbers, usually without saying where they came from or what they measured. We sell 3D models, so we would like those numbers to be impressive. We would also like not to be caught overselling. Below, each commonly quoted figure is checked against its source, with what it does and does not prove.
The 94 percent figure
The claim is that products with 3D or AR content convert 94 percent more often than products without. It comes from Shopify, posting on 23 September 2020, reporting on its own merchant data.
It compares products that had 3D or AR content with products that did not, across Shopify stores. It was not a randomised test. Merchants who invest in 3D usually sell higher-consideration goods, tend to run better product pages overall and put the models on their best sellers. All of that widens the gap.
The direction is well supported. The size is not, so 94 percent is not a figure to build a budget on.
The Rebecca Minkoff numbers
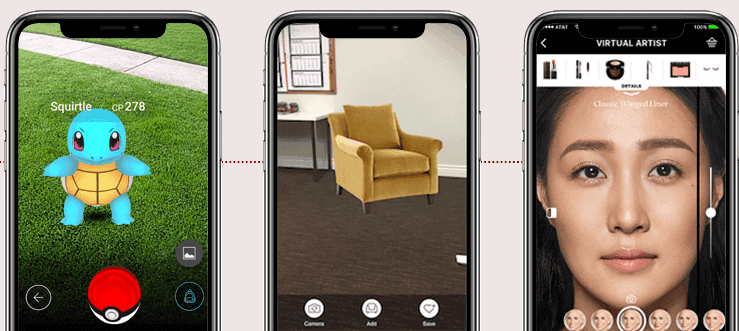
According to Shopify's write-up, shoppers who viewed a product in AR were 65 percent more likely to purchase, and shoppers who interacted with a 3D model were 44 percent more likely to add to cart and 27 percent more likely to place an order.
These figures compare shoppers who chose to open the viewer with shoppers who did not, on one brand's site. Nearly all published 3D conversion data has the same weakness. Opening a 3D viewer is a sign of intent, so part of the lift comes from the model and part comes from interested people clicking on things.
What the numbers do show is that on one brand's site, engaged shoppers convert much better, and 3D is one of the things they engage with. A proper test would split pages randomly with and without the feature, and that did not happen here.
The Gunner Kennels return figure
Shopify's article also reports a 5 percent reduction in return rates after Gunner Kennels added AR.
We trust this one more. It is small, specific and attached to a named company. Return rate is measured after the fact across all orders, including shoppers who never clicked anything, so self-selection matters less. A 5 percent relative improvement is the kind of number that holds up when you look closely.
The Oakywood figures
Shopify's 3D e-commerce article reports average order value up 458 percent in Germany, 232 percent in Switzerland and 84 percent in the UK, and a move from almost no custom orders to roughly 200 to 300 a month.
These figures come from a configurator rather than from AR, and a 458 percent change in AOV almost certainly reflects a change in what the company sold. Adding configurable custom products to a catalogue raises average order value by definition. It is a useful case study of a configurator creating a new product line. Quoted as "3D lifted AOV by 458 percent", it misleads.
What the four have in common
All four point the same way, and 3D and AR content goes with better conversion in every dataset anyone has published. Every one of those datasets is observational, produced by a platform or a vendor, and uses viewer interaction as the split. We have looked for a large independent randomised study of 3D on product pages and have not found one.
That does not make the effect imaginary. It means the published percentages are best read as upper bounds, and your own measurement counts for more.
How to measure it on your own site
You can do this without a research team.
- Pick six to ten comparable products in one category, with similar price and traffic.
- Add 3D to half. Leave the other half alone.
- Run for at least four weeks, or until each product has a few hundred sessions.
- Compare conversion rate and return rate between the two groups of products. Do not compare viewer-openers with non-openers.
The last step matters most. If you compare people who opened the viewer with people who did not, you will get something like the 94 percent figure again, with the same flaw.
What our clients report
Our clients do not usually publish controlled tests either. Sweef and MELIMELI both tell us the configurator cut the number of questions before purchase and made large catalogues sellable. Contura uses AR to answer a scale question that used to hold up orders. We believe them, but nobody has measured these effects, so we will not put percentages on them.
Returns are where the money is easiest to see. The National Retail Federation, with Appriss Retail, put the US online return rate at 17.6 percent of sales in 2023, worth 247 billion dollars. On a high-value product, a 3D model only has to prevent a small share of returns to make the cost case on its own, before conversion comes into it.
Test it on one of your products
We will build one 3D model for free so you can put it on a real product page and measure it against a comparable product. A test on your own page will tell you more than the same four statistics quoted again. Send us a product, or see what we build and what it costs if you want the scaled version.
Sources
- Shopify, merchant data on 3D and AR content, 23 September 2020.
- Shopify, AR shopping: Rebecca Minkoff and Gunner Kennels.
- Shopify, 3D e-commerce, including the Oakywood figures.
- National Retail Federation and Appriss Retail, 2023 Consumer Returns in the Retail Industry.